Introduction
Fidelity Private Shares provides several tools for reviewing your company’s equity and financing. These tools and reports are automatically updated with every transaction that is completed. This article has an overview of the available tools and reports in the Equity and Financing section. Click on the links below to jump to that section of the article.
Ownership
Modeling
Reports
- Fundraising Report
- Equity Promises Report
- Stock Ledger
- Equity Transactions
- Plan Utilization Report
- Employee Equity Report
- Track 83(b) Elections
- Rule 701 Report
- 409A Valuation
- ISO $100K Limit
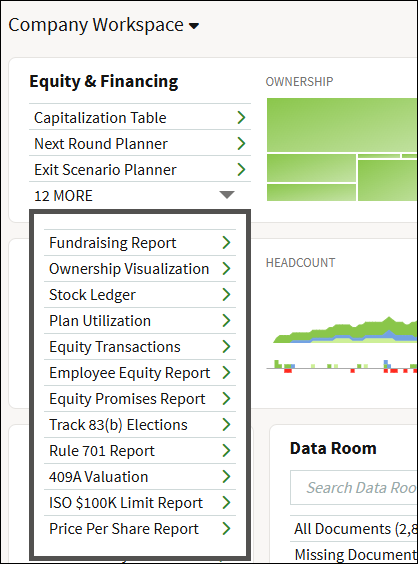
All of the reports mentioned above can be accessed via the Equity & Financing module from the company workspace.
Ownership
Capitalization Table
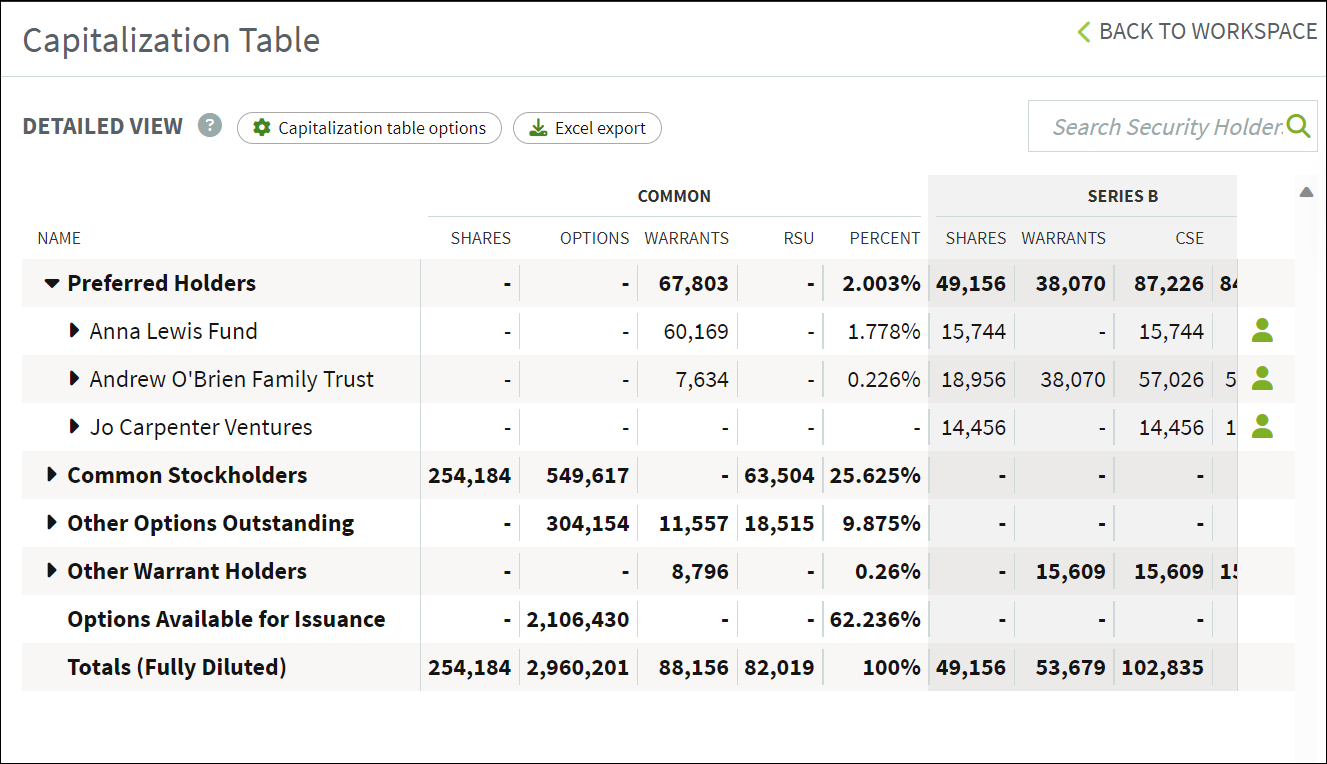
The cap table allows you to see an overview of the equity ownership in your company. For each stockholder in the cap table, you can drill down and obtain greater detail by clicking the small triangle to the left of their name. This function will list the agreements for each stockholder that have been stored in your data room. To view detailed information about the vesting schedule for each shareholder, click on the green icon on the far right. Read more about the anatomy of a cap table.
Ownership Visualization
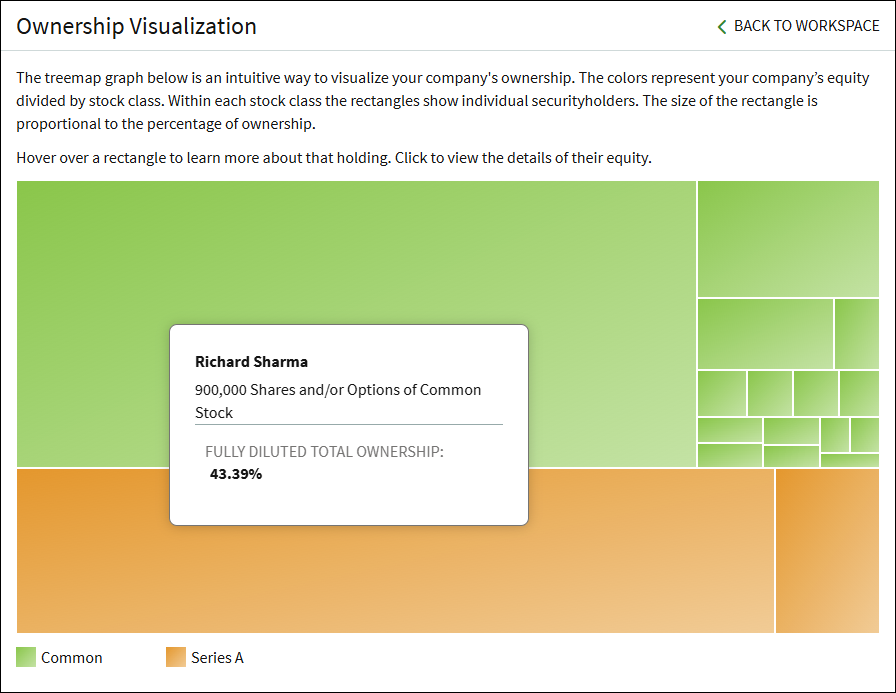
This page shows a visualization of your company's ownership. Stock classes are grouped by color. Each rectangle represents each individual stockholder and is proportional to their ownership percentage. Hovering over a rectangle will show more information for that holder (as in the screenshot below), or you can click on a rectangle to see a more detailed view of their holdings.
Modeling
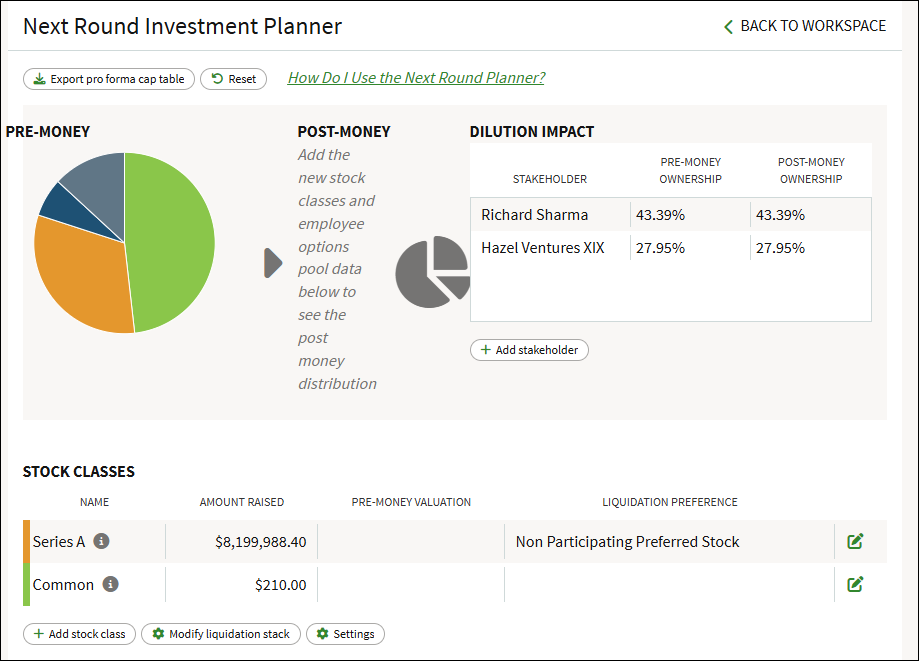
Next Round Planner
The Next Round Planner is an exploratory tool that allows you to envision how your company’s ownership may change in your company’s next theoretical financing. See this article for more information on running the Next Round Planner.
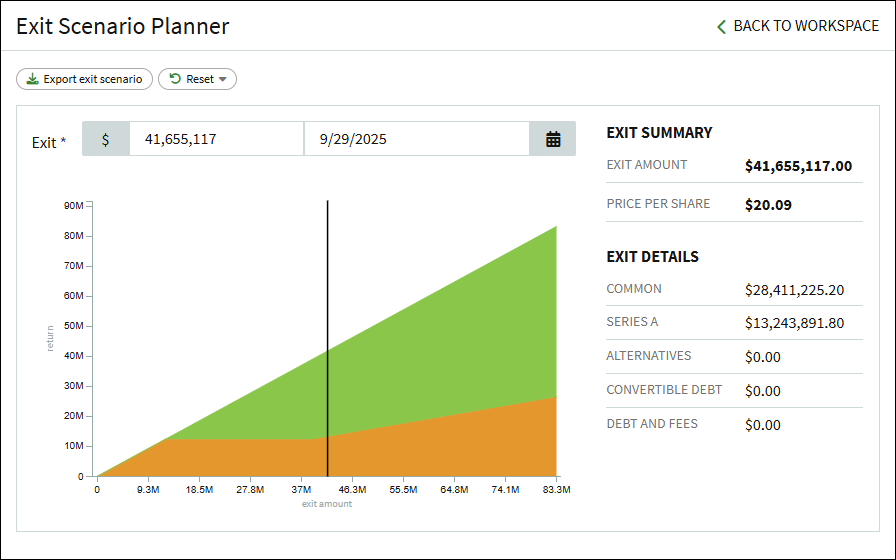
Exit Scenario Planner
The Exit Scenario Planner is an exploratory tool that allows you to envision how your company’s exit may look regarding company ownership and investment. See this article for more information on using the Exit Scenario Planner.
Reports
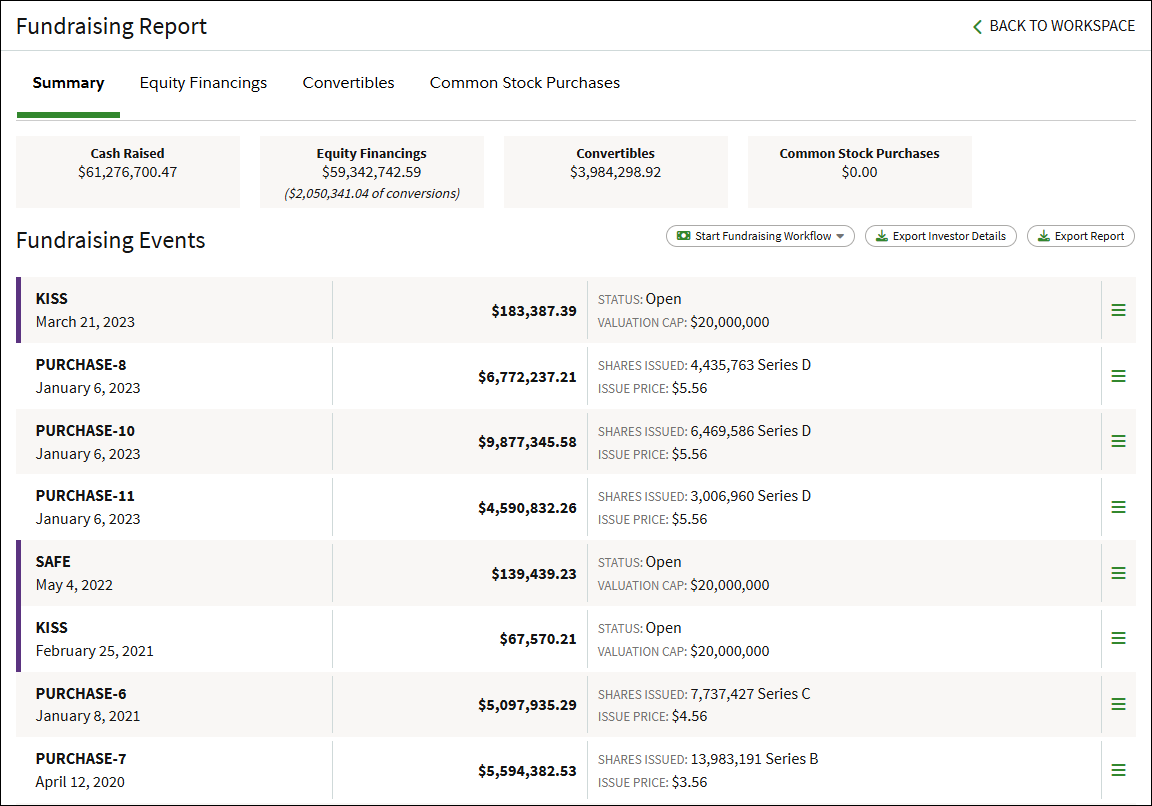
Fundraising Report
The Fundraising Report shows the company's history for completed equity financings. This report has a Summary page that shows all fundraising events, an Equity Financings page showing details for reach funding rounds, a Convertibles page showing all outstanding and converted SAFEs or notes related to an equity financing, and a Common Stock Purchases page showing related purchases that occurred during a round.
This report has buttons to start fundraising workflows or to export the report. Clicking the three-bar menu to the right of a transaction will give options to view or download the related documents for that transaction.
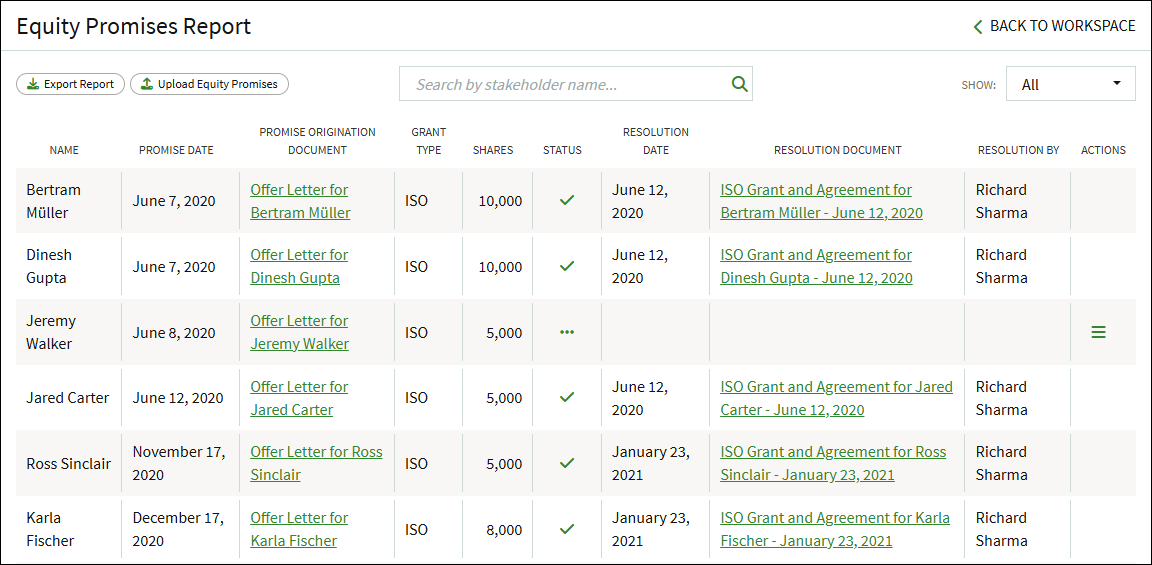
Equity Promises Report
This report lists all of the equity promises made by your company. Promises can be added when running the Add Employee workflow, or can be uploaded in bulk by clicking Upload Equity Promises.
You can export this report by clicking on the Export Report button below the heading. Promises will also be queued for issuance the next time you run the Grant Shares and Options workflow.
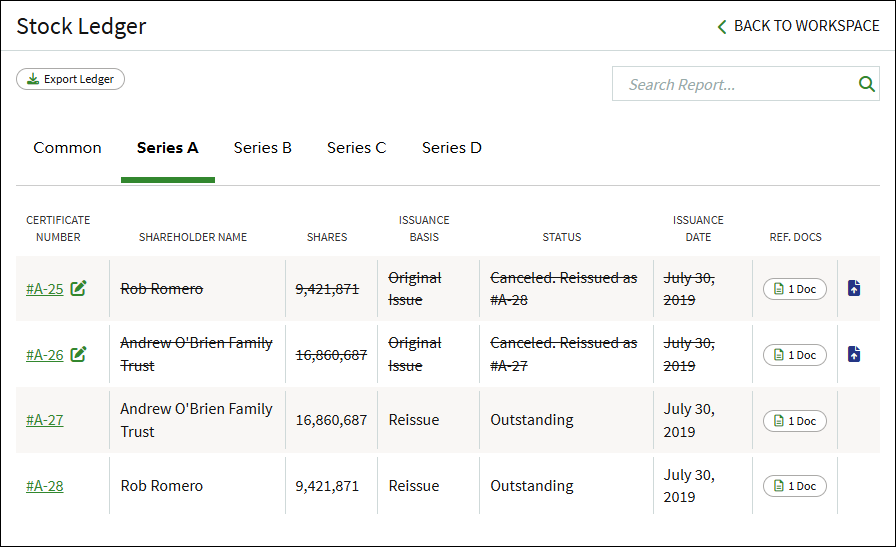
Stock Ledger
The Stock Ledger is the authoritative list of stock certificates and ownership, containing a complete list of the stock certificates issued for your company. The ledger does not include options that have not been exercised (or purchased). Each line item in the ledger contains links to the purchase agreement and stock certificate from the Data Room. The ledger is summarized by share class.
Equity Transactions
The transactions report lists each grant recipient, date and type of transaction, number of shares and the status of the 83(b) for that recipient along with repurchases, transfers, and option forfeitures. You can export this report by clicking on the Export Report button below the heading.
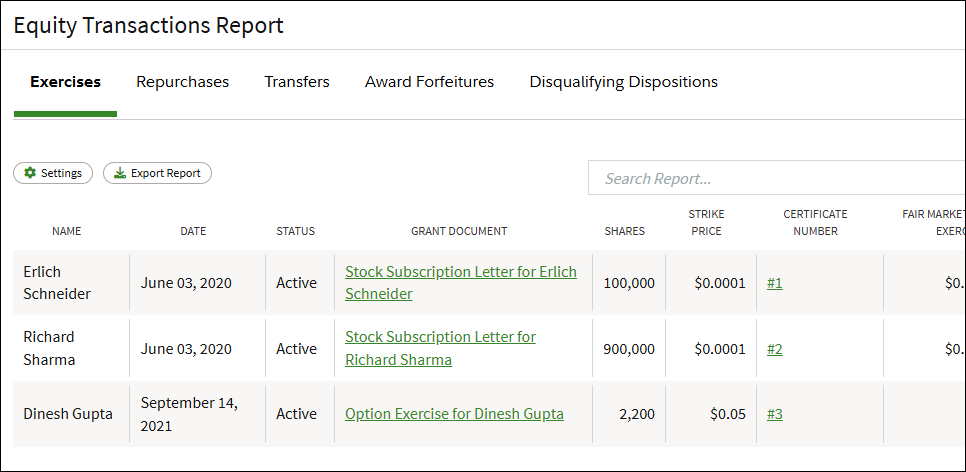
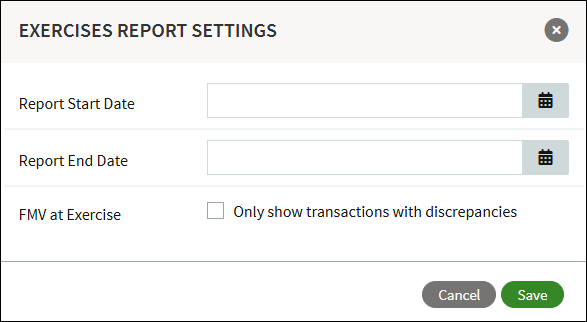
In the Equity Transaction Report you can click on Settings and apply range filters.
Plan Utilization Report
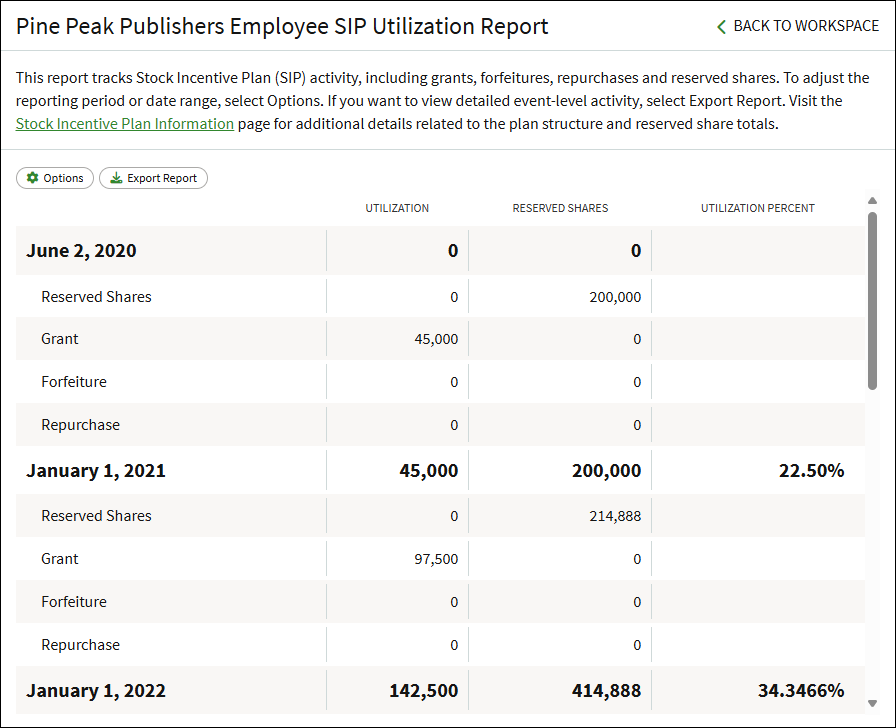
This report tracks Stock Incentive Plan (SIP) activity, including grants, forfeitures, repurchases and reserved shares. To adjust the reporting period or date range, select Options. If you want to view detailed event-level activity, select Export Report. Visit the Stock Incentive Plan Information page for additional details related to the plan structure and reserved share totals.
Employee Equity Report
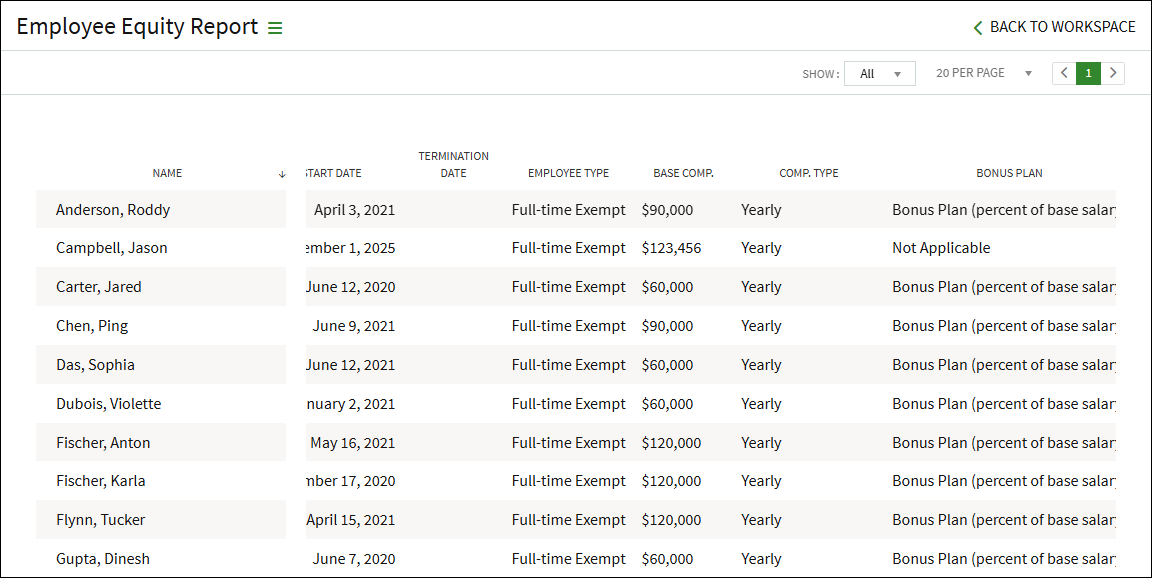
The Employee Equity report shows all employees and includes their employment information (such as their title, compensation, start date, etc.) and summary of their granted equity awards. The report can be sorted by clicking on any of the column headers. This report can be exported by clicking the three-bar menu to the right of the report name.
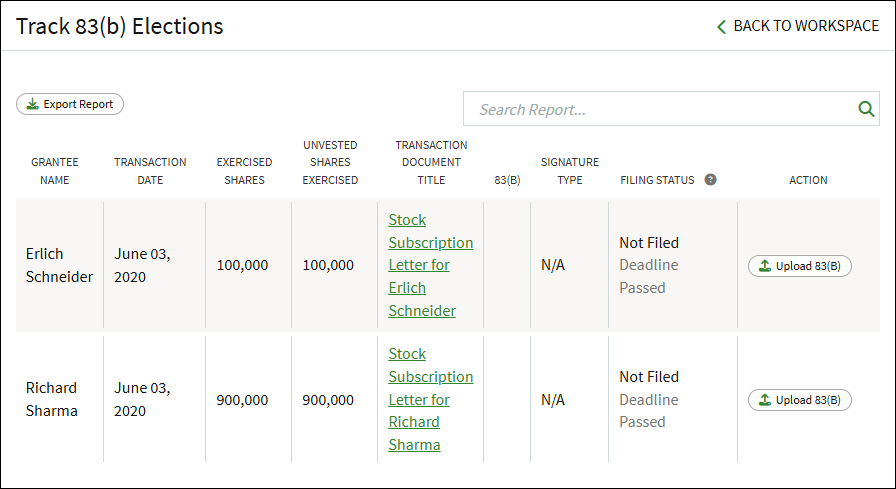
Track 83(b) Elections
This report shows applicable equity awards in which an 83(b) can be filed. Proof of a filed 83(B) can be uploaded from this report. For more information, see this article about 83(b) elections.
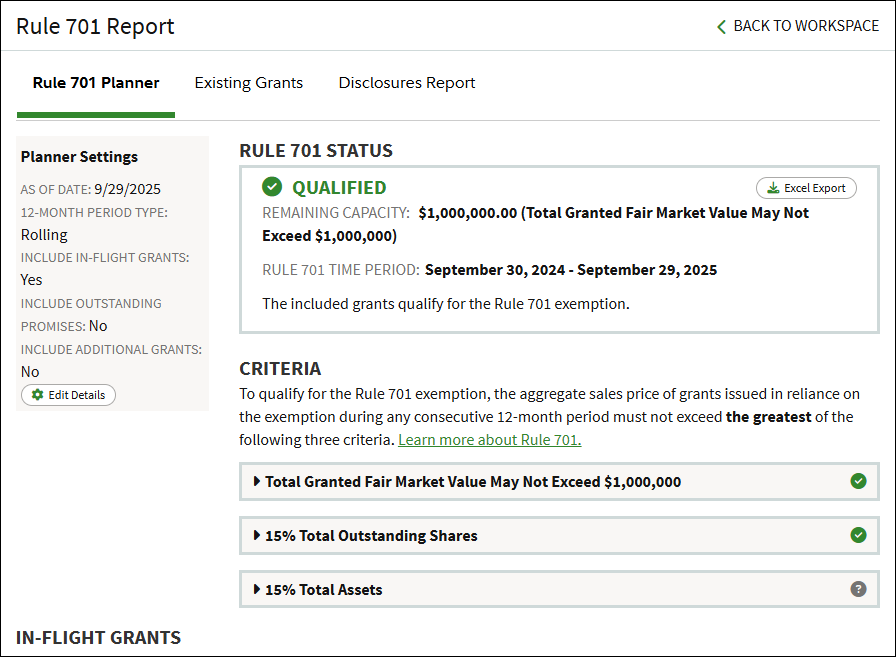
Rule 701 Report
This opens the Rule 701 Planner. The Rule 701 Planner enables you to plan future grants while qualifying for Rule 701 exemption. This report leverages the platform's power to allow you to include outstanding promises and pending grants, as well as define an aggregate value for additional grants.
This report consists of the Planner settings, Rule 701 Status, Criteria calculations, and In-flight grants. See this article for more information on the Rule 701 Planner.
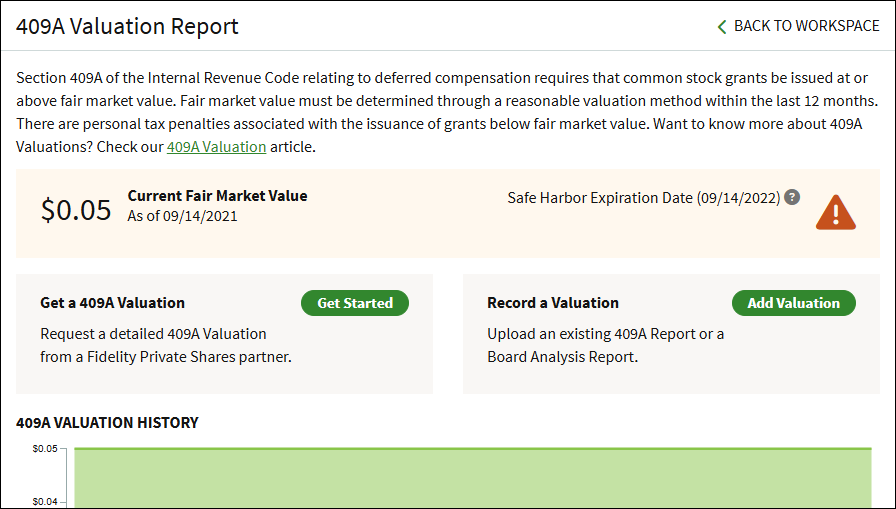
409A Valuation
This report shows an overview of your company's current Fair Market Value (FMV), lists any historical valuation reports, and allows you to either request a new 409A Valuation or to record valuations performed outside of the platform. This article has additional information on the 409A Valuations report.
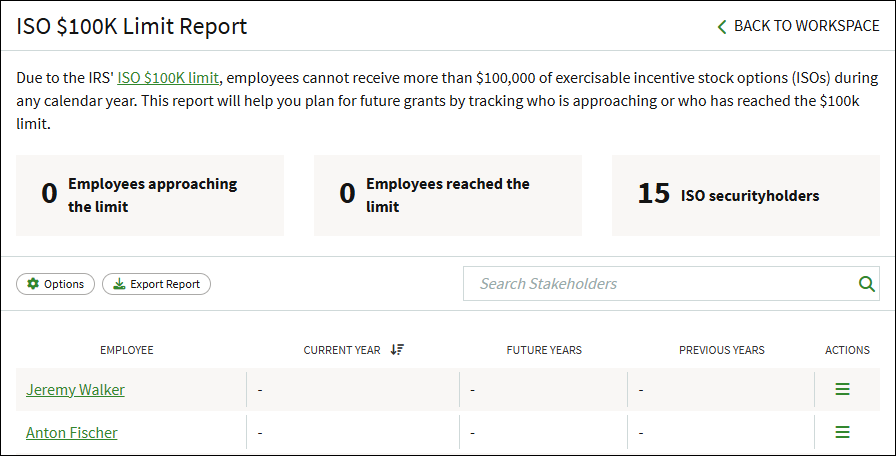
ISO $100K Limit
This report tracks employees that are close to approaching or have exceeded the IRS $100K limit on incentive stock options (ISOs). This article has more information on using this report and the $100K Limit.
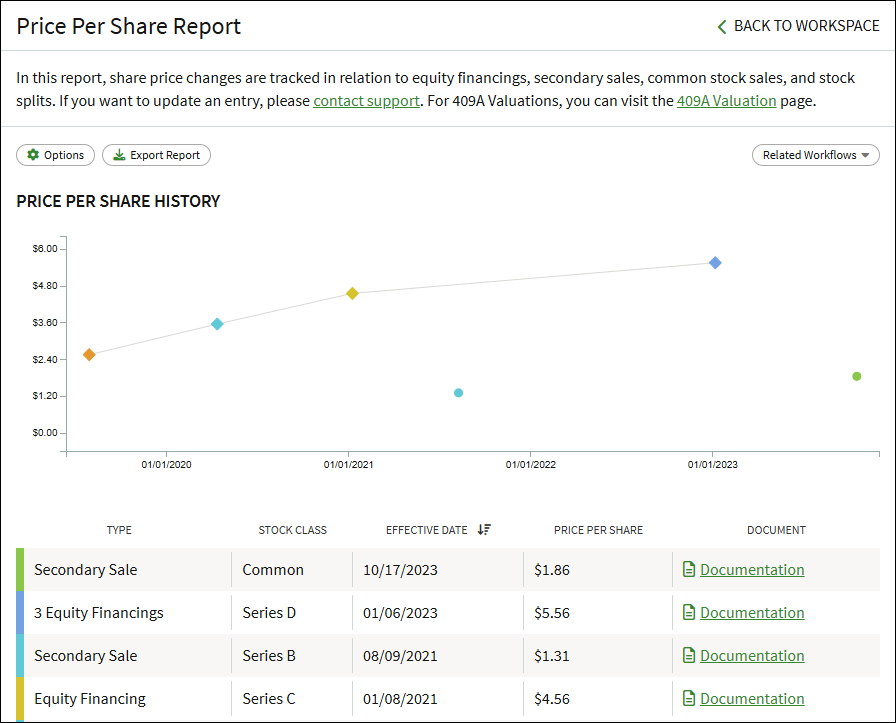
Price Per Share Report
This report tracks changes in the price per share in relation to equity financing, secondary sales, common stock sales, and stock splits. This article has additional information on the Price Per Share Report.
Screenshots are for illustrative purposes only.
409A Valuations are conducted by a third party.
Fidelity does not provide legal or tax advice. The information herein is general in nature and should not be considered legal or tax advice. Consult an attorney or tax professional regarding your specific situation.
Fidelity Private Shares LLC provides cap table management and other administrative services to private companies and their equity compensation plans.
Fidelity Private Shares LLC
© 2025 FMR LLC. All rights reserved.
1094085.3.0